Graphical User Interface: Difference between revisions
No edit summary |
No edit summary |
||
| Line 77: | Line 77: | ||
Logout | Logout | ||
Logout, and show the login dialog again. | Logout, and show the login dialog again. | ||
My Settings | |||
The My Settings window allows you to set locally stored settings. These | |||
include the Dashboard Storages which allow you to enable or disable specific | |||
storages to be counted towards the total amount visible in the datacenter | |||
summary. If no storage is checked the total is the sum of all storages, same | |||
as enabling every single one. | |||
Below the dashboard settings you find the stored user name and a button to | |||
clear it as well as a button to reset every layout in the GUI to its default. | |||
On the right side there are xterm.js Settings. These contain the following | |||
options: | |||
Font-Family | |||
The font to be used in xterm.js (e.g. Arial). | |||
Font-Size | |||
The preferred font size to be used. | |||
Letter Spacing | |||
Increases or decreases spacing between letters in text. | |||
Line Height | |||
Specify the absolute height of a line. | |||
Resource Tree | Resource Tree | ||
This is the main navigation tree. On top of the tree you can select | This is the main navigation tree. On top of the tree you can select | ||
| Line 128: | Line 146: | ||
,this can be a node, VM, Container, Storage or a pool. | ,this can be a node, VM, Container, Storage or a pool. | ||
Summary: gives a brief overview over the cluster health. | Summary: gives a brief overview over the cluster health. | ||
Cluster: allows to create/join cluster and shows join information. | |||
Options: can show and set defaults, which apply cluster wide. | Options: can show and set defaults, which apply cluster wide. | ||
Storage: is the place where a storage will add/managed/removed. | Storage: is the place where a storage will add/managed/removed. | ||
| Line 133: | Line 152: | ||
cluster wide, so you do not care about where the VM/Container are on | cluster wide, so you do not care about where the VM/Container are on | ||
your cluster at schedule time. | your cluster at schedule time. | ||
Replication: shows replication jobs and allows to create new ones. | |||
Permissions: will manage user and group permission, LDAP, | Permissions: will manage user and group permission, LDAP, | ||
MS-AD and Two-Factor authentication can be setup here. | MS-AD and Two-Factor authentication can be setup here. | ||
| Line 141: | Line 161: | ||
If you like to have more information about this see the corresponding chapter. | If you like to have more information about this see the corresponding chapter. | ||
Nodes | Nodes | ||
Nodes in your cluster can be managed invidiually at this level. | |||
The top header has useful buttons such as Reboot, Shutdown, Shell, | |||
Bulk Actions and Help. | |||
Shell has the options noVNC, SPICE and xterm.js. | |||
Bulk Actions has the options Bulk Start, Bulk Stop and Bulk Migrate. | |||
Search: it is possible to search anything on the node, | Search: it is possible to search anything on the node, | ||
this can be a VM, Container, Storage or a pool. | this can be a VM, Container, Storage or a pool. | ||
Summary: gives a brief overview over the resource usage. | Summary: gives a brief overview over the resource usage. | ||
Shell: | Notes: is where custom notes about a node can be written. | ||
System: is for configuring the network, | Shell: logs you into the shell of the node. | ||
Updates: will upgrade the system and | System: is for configuring the network, DNS and time, and also shows your syslog. | ||
Updates: will upgrade the system and inform you about new packages. | |||
Firewall: on this level is only for this node. | Firewall: on this level is only for this node. | ||
Disks: gives you a brief overview about you physical hard drives and | |||
how they are used. | how they are used. | ||
Ceph: is only used if you have installed a Ceph | Ceph: is only used if you have installed a Ceph server on your | ||
host. Then you can manage your Ceph cluster and see the status | host. Then you can manage your Ceph cluster and see the status | ||
of it here. | of it here. | ||
Task History: here all past | Replication: shows replication jobs and allows to create new ones. | ||
Task History: here all past tasks are shown. | |||
Subscription: here you can upload you subscription key and get a | Subscription: here you can upload you subscription key and get a | ||
system overview in case of a support case. | system overview in case of a support case. | ||
Guests | Guests | ||
There are two | There are two different kinds of guests and both can be converted to a template. | ||
One of them | One of them is a Kernel-based Virtual Machine (KVM) and the other one a Linux Container (LXC). | ||
Generally the navigation is the same, only some options are different. | |||
In the main management center the VM navigation | In the main management center the VM navigation begins if a VM is selected in the left tree. | ||
The top header contains important VM operation commands like Start, Shutdown, Reset, | The top header contains important VM operation commands like Start, Shutdown, Reset, | ||
Remove, Migrate, Console and Help. | Remove, Migrate, Console and Help. | ||
Some of them have hidden buttons like Shutdown has Stop and | Some of them have hidden buttons like Shutdown has Stop and | ||
Console contains the different console types SPICE, noVNC and xterm.js. | Console contains the different console types SPICE, noVNC and xterm.js. | ||
On the right side the content | On the right side the content switches depending on the selected option. | ||
On the left side. | On the left side. | ||
All available options are listed one below the other. | All available options are listed one below the other. | ||
| Line 175: | Line 201: | ||
(LXC)Network: the LXC Network settings. | (LXC)Network: the LXC Network settings. | ||
(LXC)DNS: the LXC DNS settings. | (LXC)DNS: the LXC DNS settings. | ||
Options: all | Options: all guest options can be set here. | ||
Task History: here all previous | Task History: here all previous tasks from the selected guest will be shown. | ||
(KVM) Monitor: is the interactive communication interface to the KVM process. | (KVM) Monitor: is the interactive communication interface to the KVM process. | ||
Backup: shows the available backups from | Backup: shows the available backups from the selected guest and also create a backupset. | ||
Replication: shows the replication jobs for | Replication: shows the replication jobs for the selected guest and allows to create new jobs. | ||
Snapshots: manage VM snapshots. | Snapshots: manage VM snapshots. | ||
Firewall: manage the firewall on VM level. | Firewall: manage the firewall on VM level. | ||
Permissions: manage the user permission for | Permissions: manage the user permission for the selected guest. | ||
Storage | Storage | ||
In this view we have a two partition split view. | In this view we have a two partition split-view. | ||
On the left side we have the storage options | On the left side we have the storage options | ||
and on the right side the content of the selected option will shown. | and on the right side the content of the selected option will be shown. | ||
Summary: | Summary: shows important information about storages like | ||
Usage, Type, Content, Active and Enabled. | Usage, Type, Content, Active and Enabled. | ||
Content: Here all | Content: Here all content will be listed grouped by content type. | ||
Permissions: manage the user permission for this storage. | Permissions: manage the user permission for this storage. | ||
Pools | Pools | ||
In this view we have a two partition split view. | In this view we have a two partition split view. | ||
On the left side we have the logical pool options | On the left side we have the logical pool options | ||
and on the right side the content of the selected option will shown. | and on the right side the content of the selected option will be shown. | ||
Summary: show the description of the pool. | Summary: show the description of the pool. | ||
Members: Here all members of this pool will listed and can be managed. | Members: Here all members of this pool will listed and can be managed. | ||
Revision as of 08:04, 16 April 2019
Proxmox VE is simple. There is no need to install a separate management tool, and everything can be done through your web browser (Latest Firefox or Google Chrome is preferred). A built-in HTML5 console is used to access the guest console. As an alternative, SPICE can be used.
Because we use the Proxmox cluster file system (pmxcfs), you can connect to any node to manage the entire cluster. Each node can manage the entire cluster. There is no need for a dedicated manager node.
You can use the web-based administration interface with any modern browser. When Proxmox VE detects that you are connecting from a mobile device, you are redirected to a simpler, touch-based user interface.
The web interface can be reached via https://youripaddress:8006 (default login is: root, and the password is specified during the installation process).
Features
-
Seamless integration and management of Proxmox VE clusters
-
AJAX technologies for dynamic updates of resources
-
Secure access to all Virtual Machines and Containers via SSL encryption (https)
-
Fast search-driven interface, capable of handling hundreds and probably thousands of VMs
-
Secure HTML5 console or SPICE
-
Role based permission management for all objects (VMs, storages, nodes, etc.)
-
Support for multiple authentication sources (e.g. local, MS ADS, LDAP, …)
-
Two-Factor Authentication (OATH, Yubikey)
-
Based on ExtJS 7.x JavaScript framework
Login
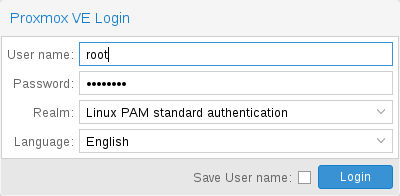
When you connect to the server, you will first see the login window. Proxmox VE supports various authentication backends (Realm), and you can select the language here. The GUI is translated to more than 20 languages.

|
You can save the user name on the client side by selecting the checkbox at the bottom. This saves some typing when you login next time. |
GUI Overview
The Proxmox VE user interface consists of four regions.
|
Header
|
On top. Shows status information and contains buttons for most important actions. |
|
Resource Tree
|
At the left side. A navigation tree where you can select specific objects. |
|
Content Panel
|
Center region. Selected objects display configuration options and status here. |
|
Log Panel
|
At the bottom. Displays log entries for recent tasks. You can double-click on those log entries to get more details, or to abort a running task. |
|
|
You can shrink and expand the size of the resource tree and log panel, or completely hide the log panel. This can be helpful when you work on small displays and want more space to view other content. |
Header
On the top left side, the first thing you see is the Proxmox logo. Next to it is the current running version of Proxmox VE. In the search bar nearside you can search for specific objects (VMs, containers, nodes, …). This is sometimes faster than selecting an object in the resource tree.
The right part of the header contains four buttons:
|
Documentation
|
Opens a new browser window showing the reference documentation. |
|
Create VM
|
Opens the virtual machine creation wizard. |
|
Create CT
|
Open the container creation wizard. |
|
User Menu
|
Displays the identity of the user you’re currently logged in with, and clicking it opens a menu with user-specific options. In the user menu, you’ll find the My Settings dialog, which provides local UI settings. Below that, there are shortcuts for TFA (Two-Factor Authentication) and Password self-service. You’ll also find options to change the Language and the Color Theme. Finally, at the bottom of the menu is the Logout option. |
My Settings
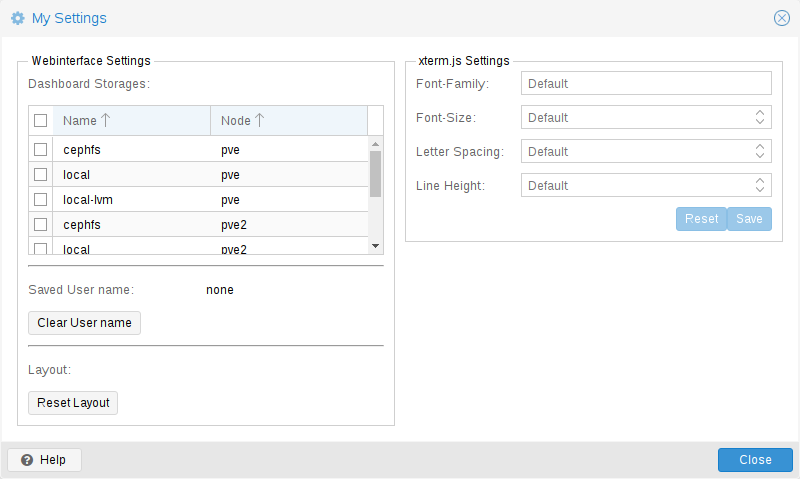
The My Settings window allows you to set locally stored settings. These include the Dashboard Storages which allow you to enable or disable specific storages to be counted towards the total amount visible in the datacenter summary. If no storage is checked the total is the sum of all storages, same as enabling every single one.
Below the dashboard settings you find the stored user name and a button to clear it as well as a button to reset every layout in the GUI to its default.
On the right side there are xterm.js Settings. These contain the following options:
|
Font-Family
|
The font to be used in xterm.js (e.g. Arial). |
|
Font-Size
|
The preferred font size to be used. |
|
Letter Spacing
|
Increases or decreases spacing between letters in text. |
|
Line Height
|
Specify the absolute height of a line. |
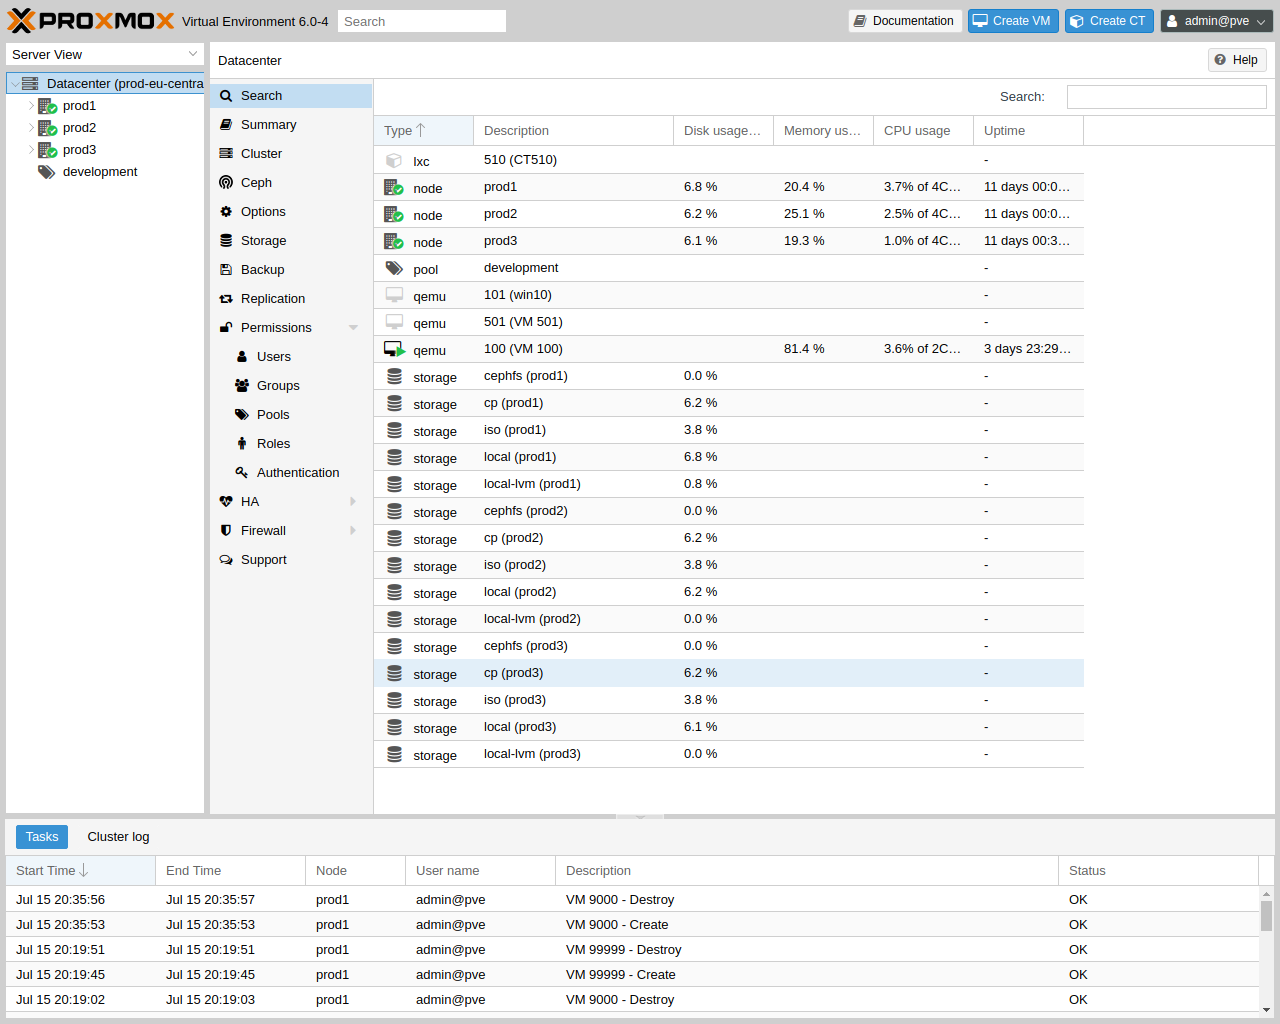
Resource Tree
This is the main navigation tree. On top of the tree you can select some predefined views, which change the structure of the tree below. The default view is the Server View, and it shows the following object types:
|
Datacenter
|
Contains cluster-wide settings (relevant for all nodes). |
|
Node
|
Represents the hosts inside a cluster, where the guests run. |
|
Guest
|
VMs, containers and templates. |
|
Storage
|
Data Storage. |
|
Pool
|
It is possible to group guests using a pool to simplify management. |
The following view types are available:
|
Server View
|
Shows all kinds of objects, grouped by nodes. |
|
Folder View
|
Shows all kinds of objects, grouped by object type. |
|
Pool View
|
Show VMs and containers, grouped by pool. |
|
Tag View
|
Show VMs and containers, grouped by tags. |
Log Panel
The main purpose of the log panel is to show you what is currently going on in your cluster. Actions like creating an new VM are executed in the background, and we call such a background job a task.
Any output from such a task is saved into a separate log file. You can view that log by simply double-click a task log entry. It is also possible to abort a running task there.
Please note that we display the most recent tasks from all cluster nodes here. So you can see when somebody else is working on another cluster node in real-time.
|
|
We remove older and finished task from the log panel to keep that list short. But you can still find those tasks within the node panel in the Task History. |
Some short-running actions simply send logs to all cluster members. You can see those messages in the Cluster log panel.
Content Panels
When you select an item from the resource tree, the corresponding object displays configuration and status information in the content panel. The following sections provide a brief overview of this functionality. Please refer to the corresponding chapters in the reference documentation to get more detailed information.
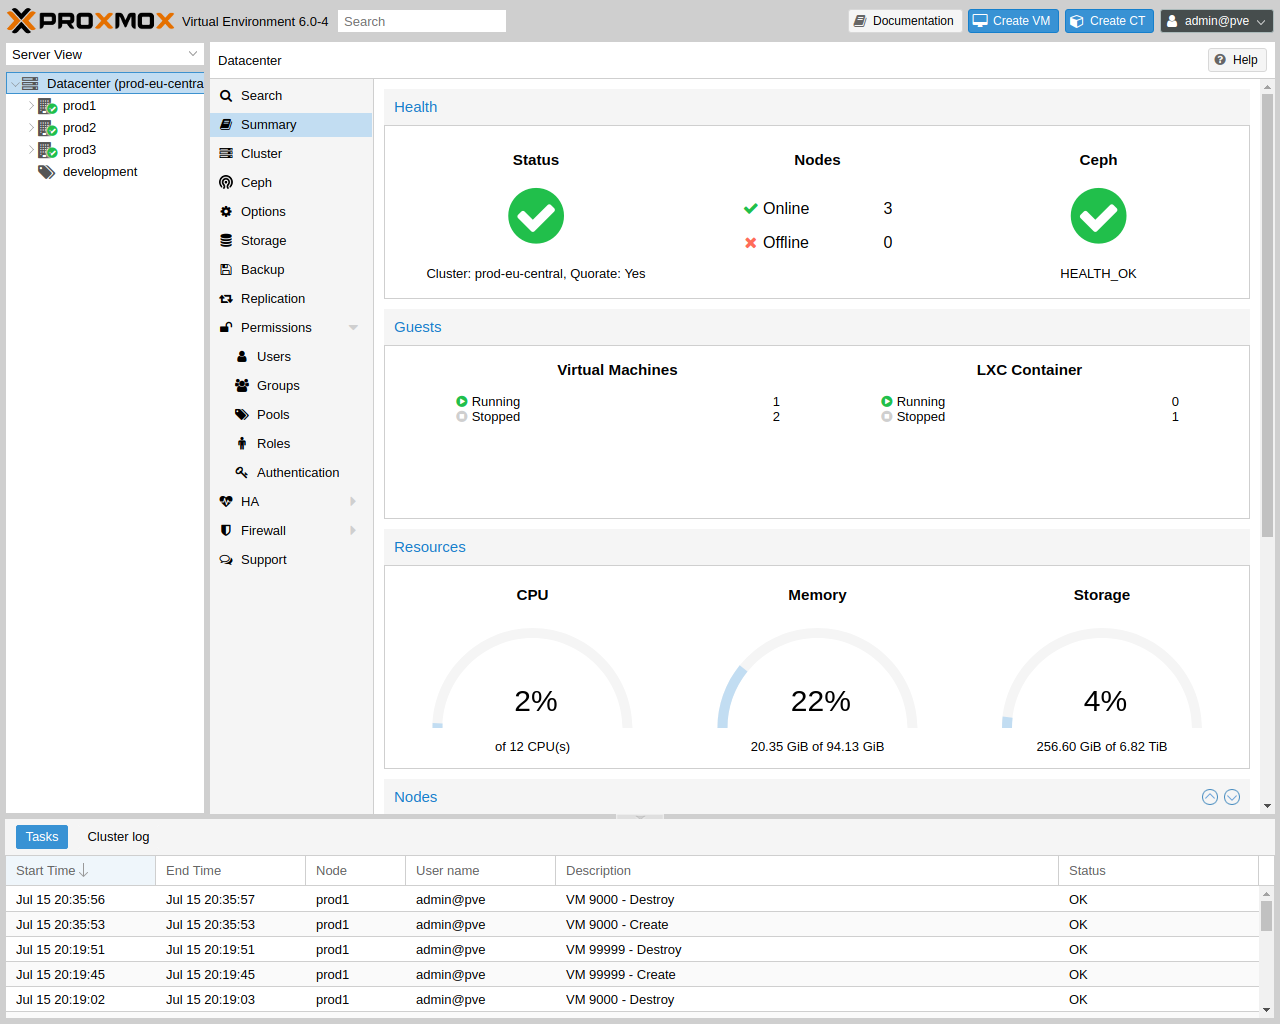
Datacenter
On the datacenter level, you can access cluster-wide settings and information.
-
Search: perform a cluster-wide search for nodes, VMs, containers, storage devices, and pools.
-
Summary: gives a brief overview of the cluster’s health and resource usage.
-
Cluster: provides the functionality and information necessary to create or join a cluster.
-
Options: view and manage cluster-wide default settings.
-
Storage: provides an interface for managing cluster storage.
-
Backup: schedule backup jobs. This operates cluster wide, so it doesn’t matter where the VMs/containers are on your cluster when scheduling.
-
Replication: view and manage replication jobs.
-
Permissions: manage user, group, and API token permissions, and LDAP, MS-AD and Two-Factor authentication.
-
HA: manage Proxmox VE High Availability.
-
ACME: set up ACME (Let’s Encrypt) certificates for server nodes.
-
Firewall: configure and make templates for the Proxmox Firewall cluster wide.
-
Metric Server: define external metric servers for Proxmox VE.
-
Notifications: configurate notification behavior and targets for Proxmox VE.
-
Support: display information about your support subscription.
Nodes
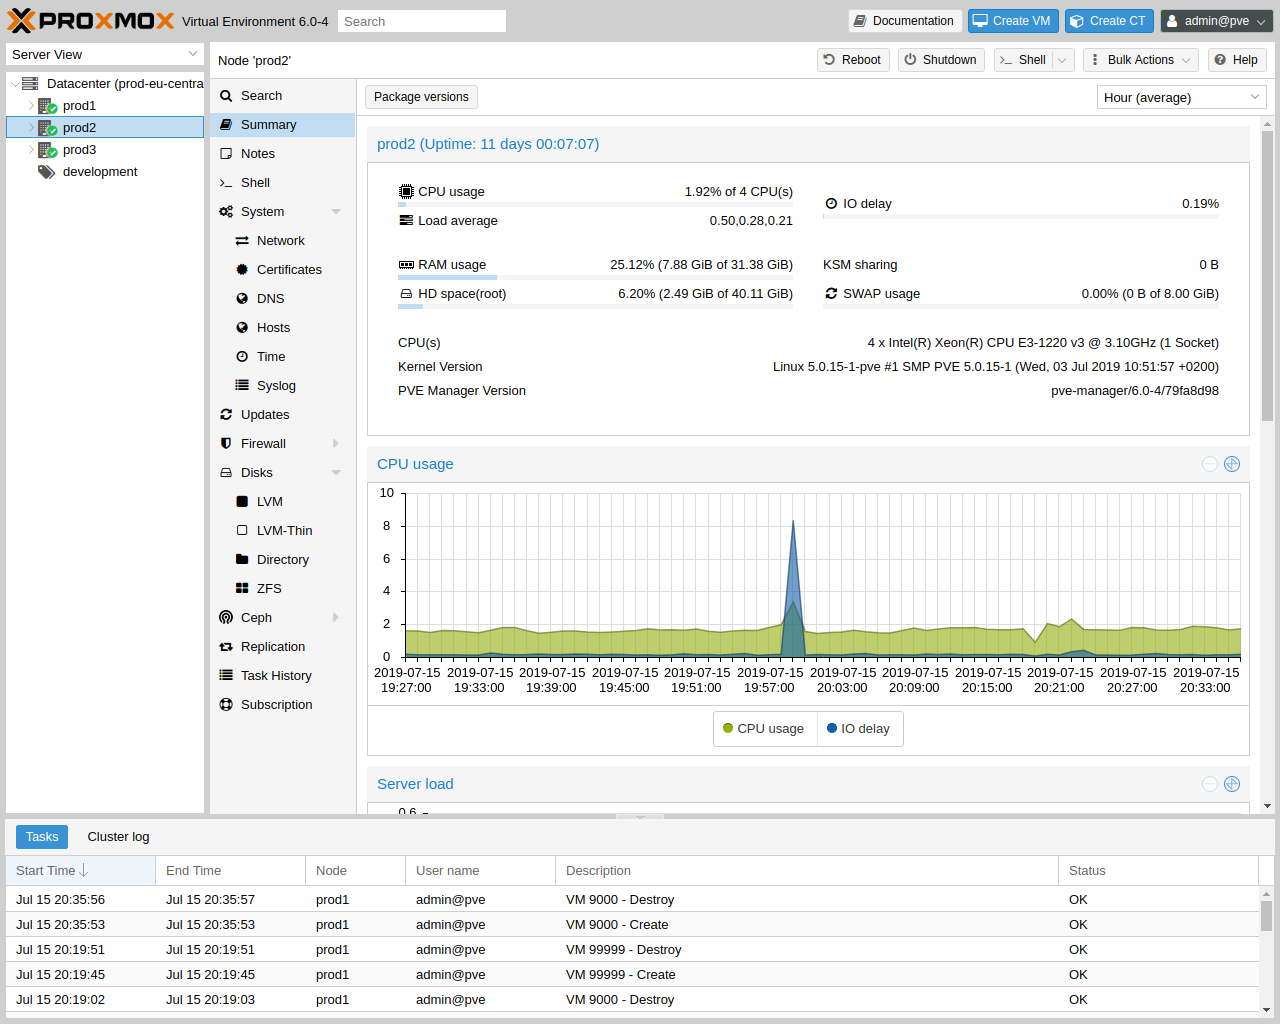
Nodes in your cluster can be managed individually at this level.
The top header has useful buttons such as Reboot, Shutdown, Shell, Bulk Actions and Help. Shell has the options noVNC, SPICE and xterm.js. Bulk Actions has the options Bulk Start, Bulk Shutdown and Bulk Migrate.
-
Search: search a node for VMs, containers, storage devices, and pools.
-
Summary: display a brief overview of the node’s resource usage.
-
Notes: write custom comments in Markdown syntax.
-
Shell: access to a shell interface for the node.
-
System: configure network, DNS and time settings, and access the syslog.
-
Updates: upgrade the system and see the available new packages.
-
Firewall: manage the Proxmox Firewall for a specific node.
-
Disks: get an overview of the attached disks, and manage how they are used.
-
Ceph: is only used if you have installed a Ceph server on your host. In this case, you can manage your Ceph cluster and see the status of it here.
-
Replication: view and manage replication jobs.
-
Task History: see a list of past tasks.
-
Subscription: upload a subscription key, and generate a system report for use in support cases.
Guests
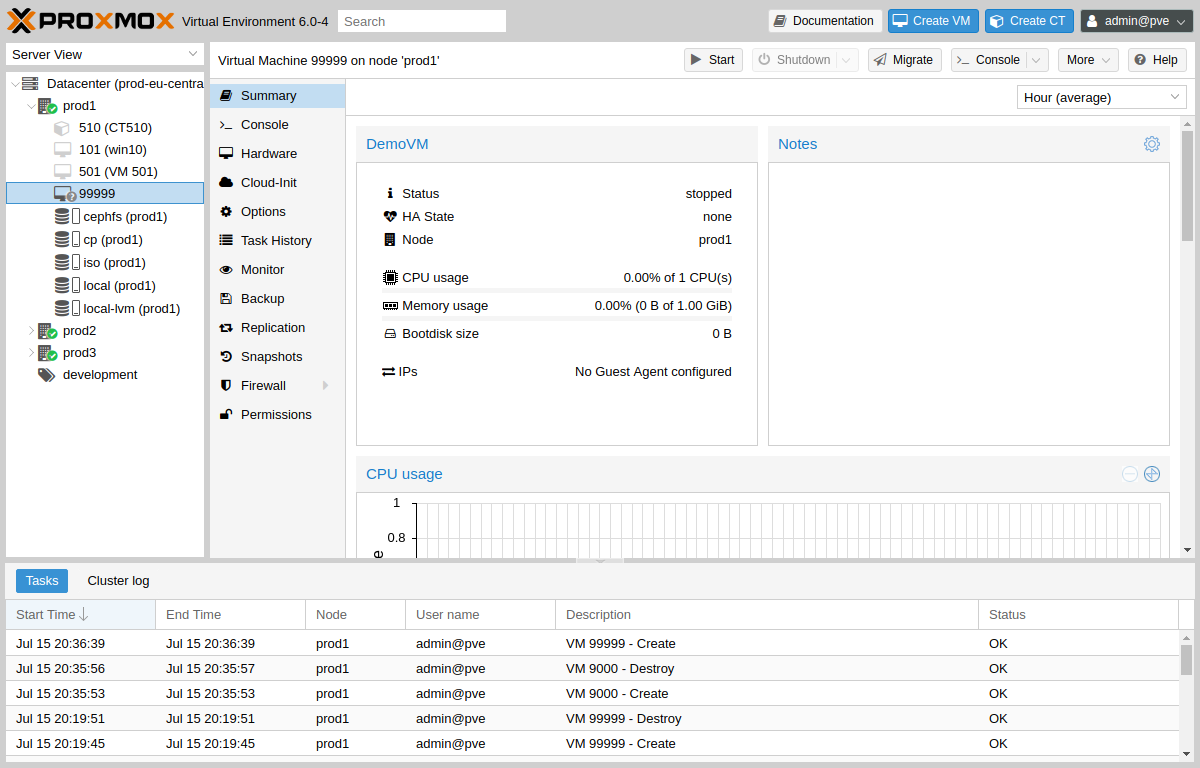
There are two different kinds of guests and both can be converted to a template. One of them is a Kernel-based Virtual Machine (KVM) and the other is a Linux Container (LXC). Navigation for these are mostly the same; only some options are different.
To access the various guest management interfaces, select a VM or container from the menu on the left.
The header contains commands for items such as power management, migration, console access and type, cloning, HA, and help. Some of these buttons contain drop-down menus, for example, Shutdown also contains other power options, and Console contains the different console types: SPICE, noVNC and xterm.js.
The panel on the right contains an interface for whatever item is selected from the menu on the left.
The available interfaces are as follows.
-
Summary: provides a brief overview of the VM’s activity and a Notes field for Markdown syntax comments.
-
Console: access to an interactive console for the VM/container.
-
(KVM)Hardware: define the hardware available to the KVM VM.
-
(LXC)Resources: define the system resources available to the LXC.
-
(LXC)Network: configure a container’s network settings.
-
(LXC)DNS: configure a container’s DNS settings.
-
Options: manage guest options.
-
Task History: view all previous tasks related to the selected guest.
-
(KVM) Monitor: an interactive communication interface to the KVM process.
-
Backup: create and restore system backups.
-
Replication: view and manage the replication jobs for the selected guest.
-
Snapshots: create and restore VM snapshots.
-
Firewall: configure the firewall on the VM level.
-
Permissions: manage permissions for the selected guest.
Storage
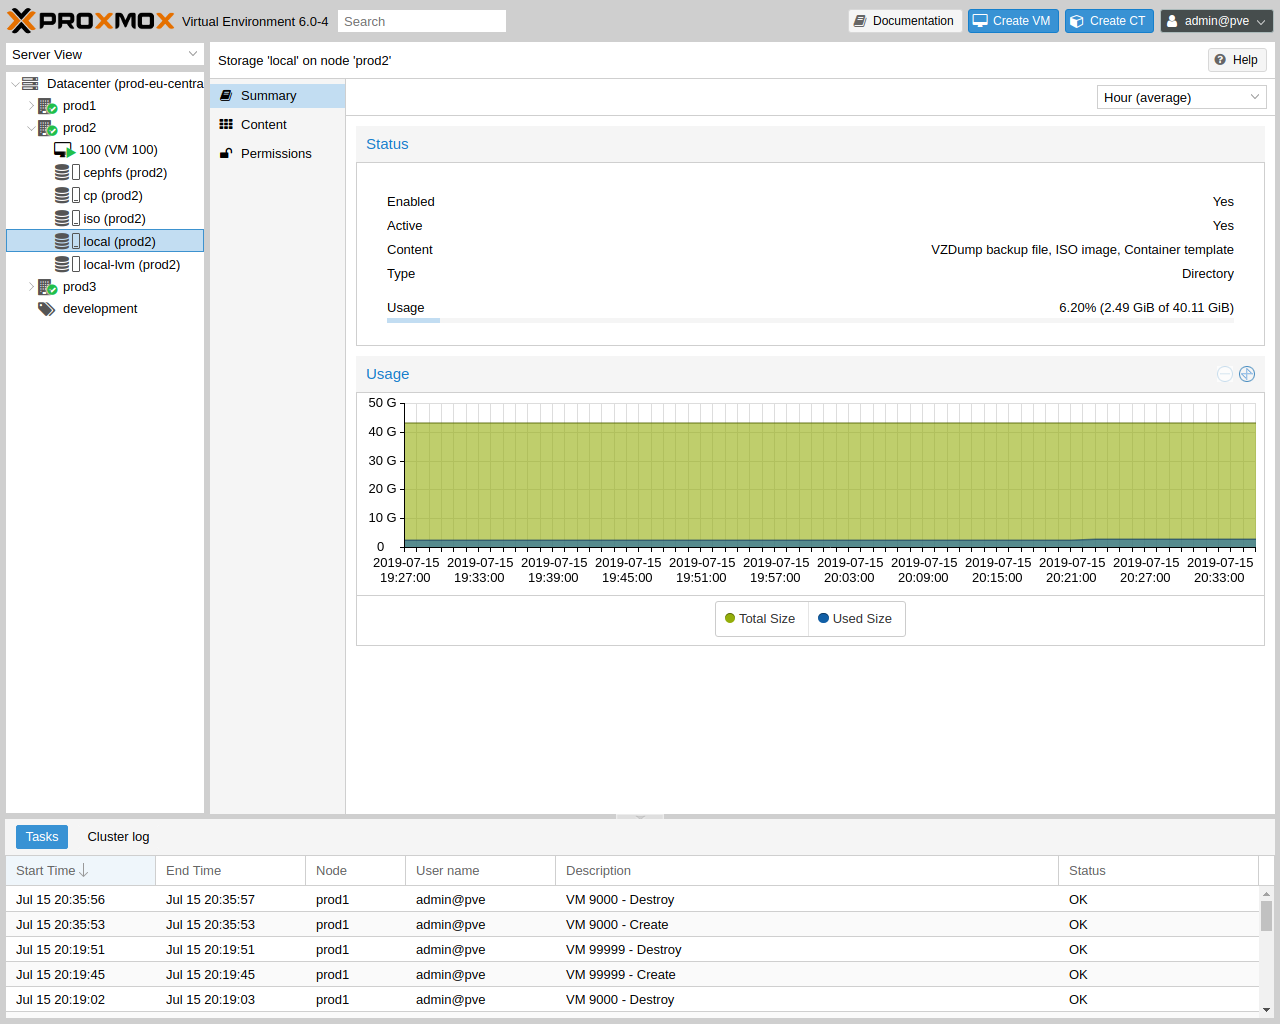
As with the guest interface, the interface for storage consists of a menu on the left for certain storage elements and an interface on the right to manage these elements.
In this view we have a two partition split-view. On the left side we have the storage options and on the right side the content of the selected option will be shown.
-
Summary: shows important information about the storage, such as the type, usage, and content which it stores.
-
Content: a menu item for each content type which the storage stores, for example, Backups, ISO Images, CT Templates.
-
Permissions: manage permissions for the storage.
Pools
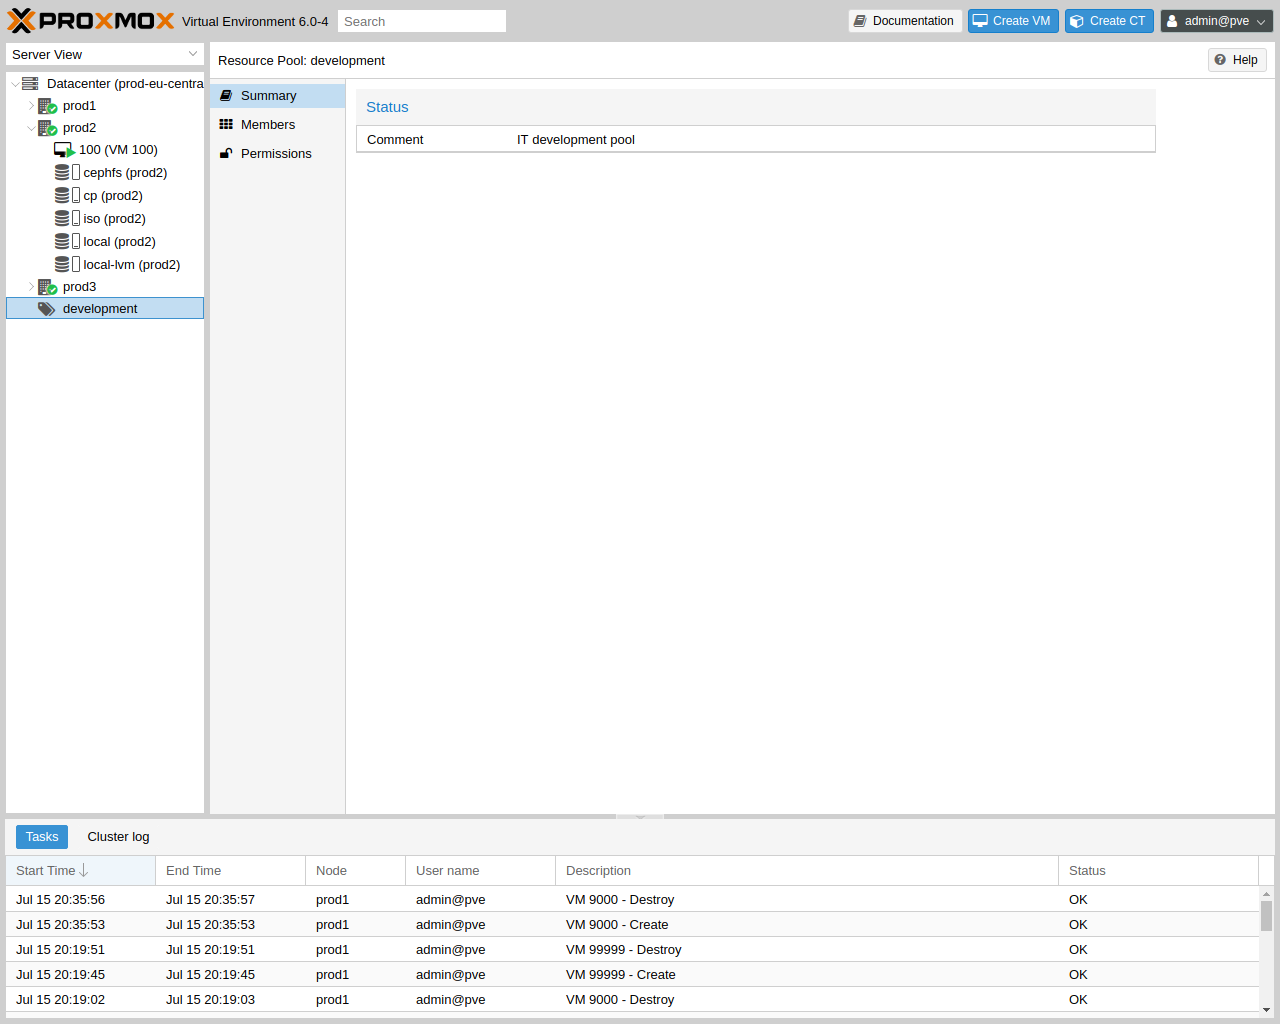
Again, the pools view comprises two partitions: a menu on the left, and the corresponding interfaces for each menu item on the right.
-
Summary: shows a description of the pool.
-
Members: display and manage pool members (guests and storage).
-
Permissions: manage the permissions for the pool.
Tags
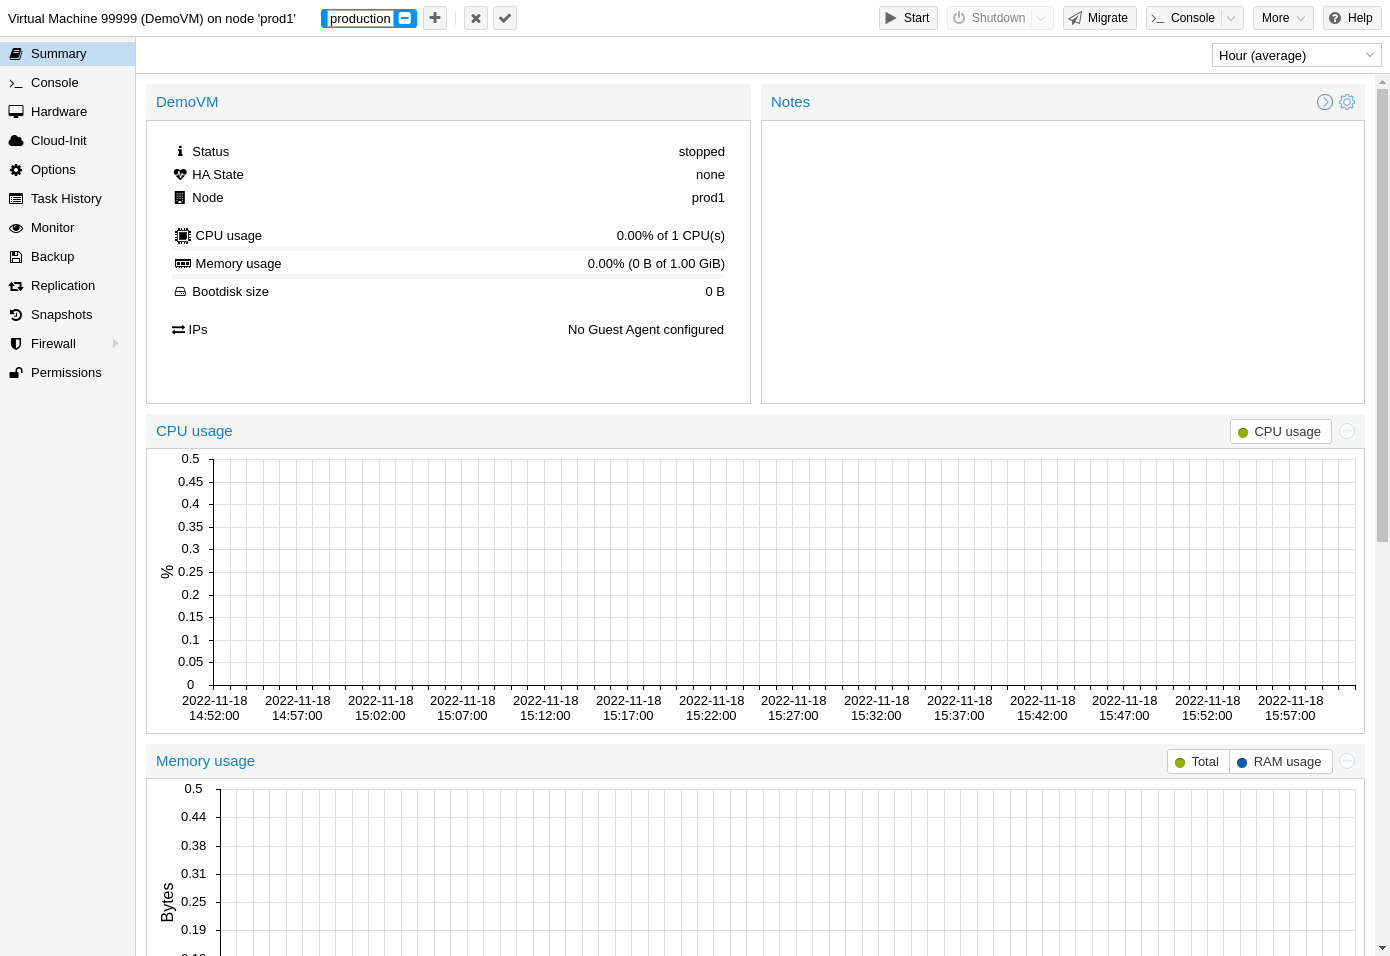
For organizational purposes, it is possible to set tags for guests. Currently, these only provide informational value to users. Tags are displayed in two places in the web interface: in the Resource Tree and in the status line when a guest is selected.
Tags can be added, edited, and removed in the status line of the guest by clicking on the pencil icon. You can add multiple tags by pressing the + button and remove them by pressing the - button. To save or cancel the changes, you can use the ✓ and x button respectively.
Tags can also be set via the CLI, where multiple tags are separated by semicolons. For example:
# qm set ID --tags myfirsttag;mysecondtag
Style Configuration
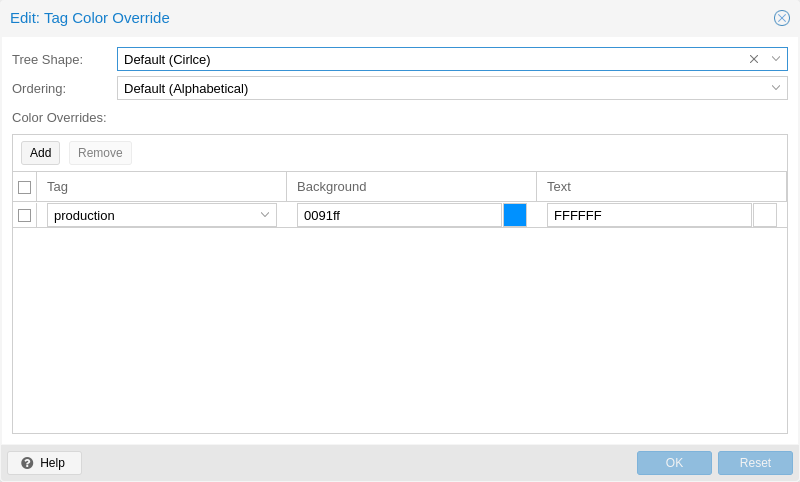
By default, the tag colors are derived from their text in a deterministic way. The color, shape in the resource tree, and case-sensitivity, as well as how tags are sorted, can be customized. This can be done via the web interface under Datacenter → Options → Tag Style Override. Alternatively, this can be done via the CLI. For example:
# pvesh set /cluster/options --tag-style color-map=example:000000:FFFFFF
sets the background color of the tag example to black (#000000) and the text color to white (#FFFFFF).
Permissions
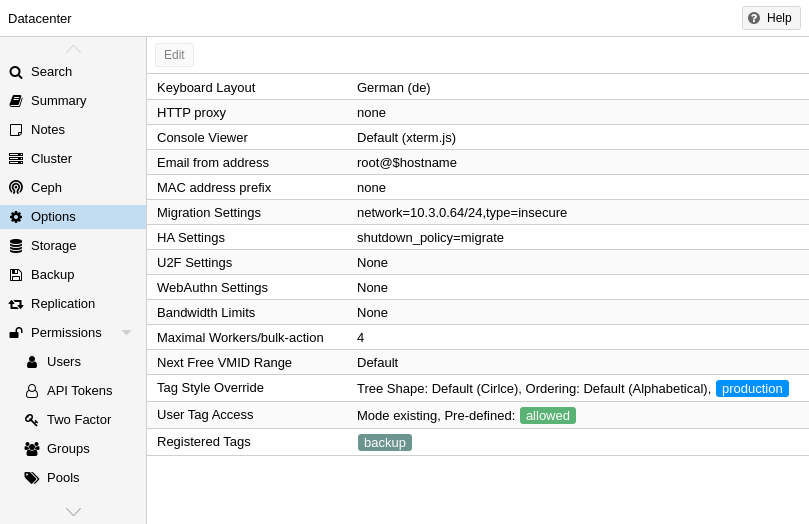
By default, users with the privilege VM.Config.Options on a guest (/vms/ID) can set any tags they want (see Permission Management). If you want to restrict this behavior, appropriate permissions can be set under Datacenter → Options → User Tag Access:
-
free: users are not restricted in setting tags (Default)
-
list: users can set tags based on a predefined list of tags
-
existing: like list but users can also use already existing tags
-
none: users are restricted from using tags
The same can also be done via the CLI.
Note that a user with the Sys.Modify privileges on / is always able to set or delete any tags, regardless of the settings here. Additionally, there is a configurable list of registered tags which can only be added and removed by users with the privilege Sys.Modify on /. The list of registered tags can be edited under Datacenter → Options → Registered Tags or via the CLI.
For more details on the exact options and how to invoke them in the CLI, see Datacenter Configuration.
Consent Banner
A custom consent banner that has to be accepted before login can be configured in Datacenter → Options → Consent Text. If there is no content, the consent banner will not be displayed. The text will be stored as a base64 string in the /etc/pve/datacenter.cfg config file.
See Also
-
link:/wiki/Central_Web-based_Management